What you'll learn:
- Scalability settings and CVars for lighting quality control
- Console commands to measure frame time and GPU cost
- View modes for debugging lighting (Lighting Only, Light Complexity)
- How to identify your performance bottleneck
- How overlapping lights affect performance with dynamic shadows
Section 16: Scalability & Quality Settings (5 min)
Scalability is Unreal's "quality preset" system. It changes many settings at once, which makes it the fastest way to:
- A/B test lighting quality vs performance
- Match your target hardware
- Understand what's actually expensive (usually Shadows / GI / Reflections)
In the editor:
Settings → Engine Scalability Settings
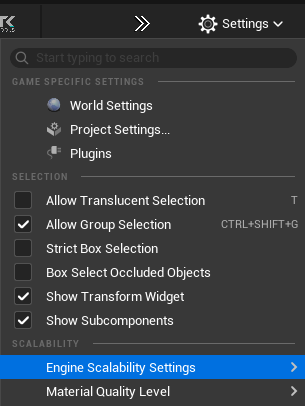 Settings menu - Engine Scalability Settings
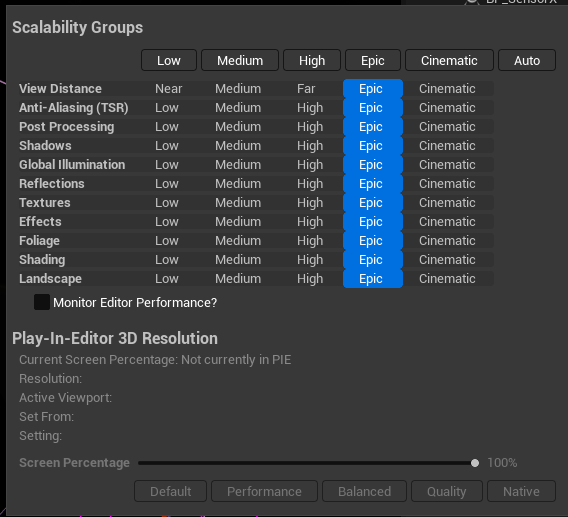 Scalability Groups UI
These modes apply to multiple groups at once (Shadows, GI, Reflections, etc.). In practice:
| Mode | What It Usually Does (for lighting) |
|---|---|
| Low | Lower shadow resolution, fewer samples, reduced/fallback GI & reflections |
| Medium | Better than Low, but still compromises shadow stability and GI/reflection quality |
| High | Good "shipping baseline" for many projects |
| Epic | Great look-dev default; higher-quality shadows and lighting stability |
| Cinematic | Maximum quality; intended for cinematics/offline capture, often expensive |
| Auto | Engine chooses based on performance and heuristics (can change while working) |
| Group | Why It Matters |
|---|---|
| Shadows | Biggest visual impact; also often the biggest GPU cost |
| Global Illumination | Controls GI quality/cost and stability |
| Reflections | Controls reflection quality/cost (especially on glossy/metal surfaces) |
| Post Processing | Exposure/AA/DOF/bloom can affect the perceived "quality" of lighting |
| Anti-Aliasing (TSR) | Impacts stability/shimmering (which can look like shadow noise) |
- Do look-dev at Epic (or Cinematic for final captures).
- When optimizing, change one group at a time (Shadows first, then GI, then Reflections).
- Always validate in the scenario that matters (PIE, target camera, worst-case view).
Scalability is the broad hammer. For precise control, use CVars.
Scalability groups (quick):
sg.ShadowQuality 0-4
sg.GlobalIlluminationQuality 0-4
sg.ReflectionQuality 0-4
VSM deep control: See Part 4: VSM Console Variables for the full list of r.Shadow.Virtual.* CVars.
Ray Tracing Culling CVars:
At far distances, RT culls geometry to save performance. Key CVars:
| Console Variable | Default | What It Does |
|---|---|---|
r.RayTracing.Culling | 3 | Master culling mode (0 = disabled) |
r.RayTracing.Culling.Radius | 10000 | Max distance for RT geometry |
r.RayTracing.Culling.Angle | 1 | Solid-angle culling (base 5°, this is multiplier) |
Tip: If RT shadows disappear on distant objects, test with
r.RayTracing.Culling 0, then tune radius/angle.
Lumen Noise CVars:
| Console Variable | Default | What It Does |
|---|---|---|
r.Lumen.ScreenProbeGather.SpatialFilterNumPasses | 3 | Spatial filter passes (increase for smoother GI) |
r.Lumen.ScreenProbeGather.SpatialFilterHalfKernelSize | 1 | Kernel size for denoising |
Section 17: Performance Monitoring (5 min)
When choosing between shadow systems (or adjusting any quality settings), you need objective data. "It looks fine" isn't enough — you need to know your frame budget.
In-Editor (viewport):
- Performance may differ from Play mode — editor has overhead
- Good for quick visual checks, not for final benchmarking
In Play Mode (PIE) — more accurate:
- Closer to actual game performance
- Use this for real measurements
Press ` (backtick) to open console, then use these commands:
| Command | What It Shows |
|---|---|
Stat FPS | Framerate and frame time (ms) |
Stat Unit | Game thread, render thread, GPU time breakdown |
Stat GPU | Detailed GPU pass timings |
ProfileGPU | One-frame GPU capture with hierarchical breakdown |
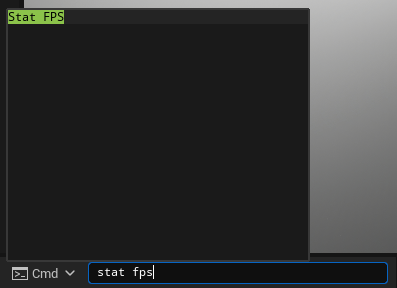 Stat FPS Command
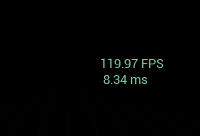 Stat FPS Output
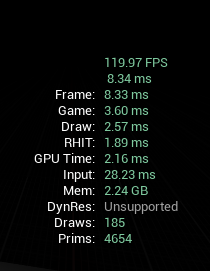 Stat Unit Detailed Output
Stat Unit breaks down frame time into:
| Thread | What It Measures |
|---|---|
| Game | Game logic, Blueprints, AI, physics |
| Draw | CPU time preparing render commands |
| GPU | Actual GPU rendering time |
Your bottleneck is the largest number. If GPU time is highest, lighting/shadows are likely the culprit.
Frame time (in ms) is more useful than FPS for optimization because it's linear.
| Target FPS | Frame Budget |
|---|---|
| 30 fps | 33.3 ms |
| 60 fps | 16.6 ms |
| 120 fps | 8.3 ms |
If GPU time exceeds your budget, reduce quality settings or switch shadow methods.
Section 18: View Modes for Debugging (3 min)
Unreal's View Modes let you visualize specific aspects of your lighting. Access them via the viewport dropdown or keyboard shortcuts.
- Shows only lighting contribution — no textures, no materials
- Useful for evaluating shadow quality, light falloff, and overall illumination balance
- If your scene looks good in Lighting Only, your lighting fundamentals are solid
- Heat map visualization showing how many lights affect each pixel
- Green = few lights, Red = many overlapping lights
- Use this to identify areas where too many lights overlap (performance hotspots)
- Access via: View Mode → Optimization Viewmodes → Light Complexity
Tip: Light Complexity is especially valuable when using dynamic lighting. Areas that appear red are prime candidates for light culling, reduced shadow quality, or consolidating multiple lights into fewer sources.
Section 19: FPS Caps & Profiling (4 min)
Unreal caps framerate by default, which can hide your actual performance. To get accurate measurements:
Check if FPS is capped (console):
t.MaxFPS
Returns current cap (0 = uncapped)
Uncap FPS temporarily (console):
t.MaxFPS 0
Now you'll see true performance. Useful for benchmarking.
Set a specific cap (console):
t.MaxFPS 60
t.MaxFPS 120
Project Settings (permanent):
Project Settings > Engine > General Settings > Framerate:
    ☐ Use Fixed Frame Rate — unchecked = uncapped
    ☑ Use Fixed Frame Rate — checked = uses value below
    Fixed Frame Rate: 60.0 (or your target)
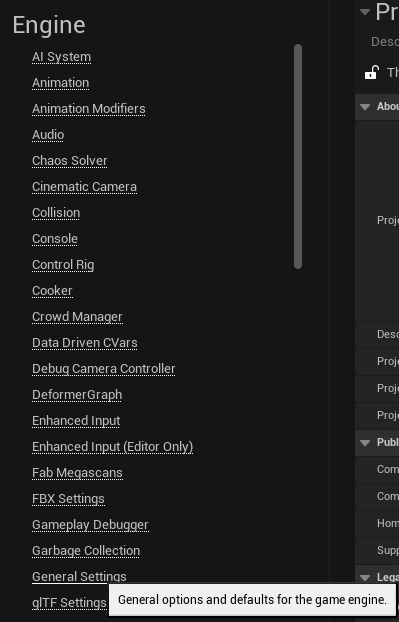 Engine General Settings Navigation
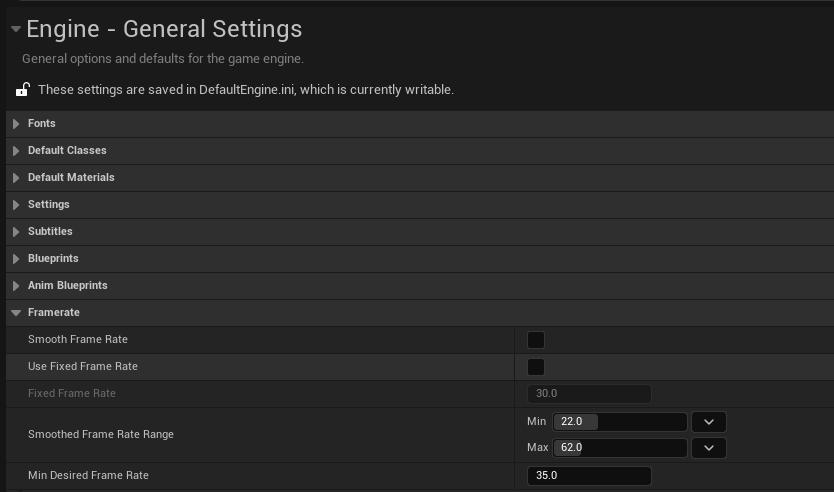 Engine General Settings - Framerate
The editor viewport has its own cap separate from Play mode. To display FPS in the editor:
Editor Preferences > General > Performance:
    ☑ Show Frame Rate and Memory
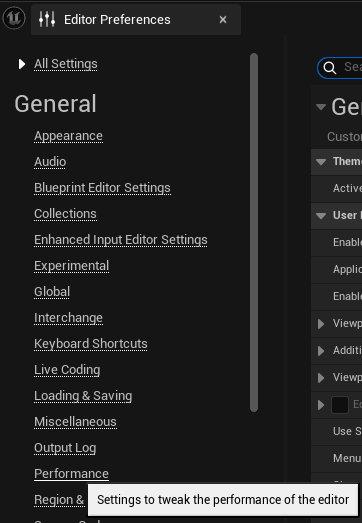 Editor Preferences
 Editor Performance Setting
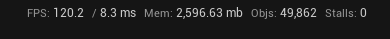 Editor FPS Display
- Hit Play (Alt+P)
- Open console (`)
- Type
Stat FPS— shows current framerate - Type
Stat Unit— shows where time is spent (Game/Draw/GPU) - Toggle features on/off and compare frame times
- A/B test: Change one setting, compare frame times
- Worst case: Find your most expensive view/area
- Consistency: Multiple samples, not just one frame
- Real content: Test with final art, not placeholder boxes
Section 20: Lighting Overlap & Performance (5 min)
With Force No Precompute enabled, all lighting is dynamic. This changes how the engine handles overlapping lights and shadows — there are no baked limits, but GPU cost becomes your primary constraint.
| Shadow Method | Overlap Limit | Main Limitation |
|---|---|---|
| Shadow Maps | No hard limit | GPU cost scales with each overlapping shadow map |
| Virtual Shadow Maps | No hard limit | GPU cost scales; handles Nanite efficiently but overlaps add load |
| Distance Field Shadows | Stationary limit lifted* | Performance cost scales with overlapping DF shadows |
| Ray Tracing Shadows | No hard limit | Heavy GPU cost — ray queries multiply with overlaps |
| MegaLights | No strict limit | GPU workload per light; requires Hardware Ray Tracing |
*The normal Stationary light overlap limit (max 4 overlapping Stationary lights per object) only applies when Lightmass baked data is used. With Force No Precompute, this limit doesn't apply — all lights act dynamically.
Shadow Maps (Dynamic Shadows)
- No strict engine limit on overlapping dynamic shadow-casting lights
- But overlapping many shadow maps increases GPU cost significantly
- Performance degrades with the number of overlapping lights casting shadows on the same geometry
Virtual Shadow Maps (VSMs)
- Similar to Shadow Maps — supports many overlapping lights dynamically
- Each overlapping VSM adds GPU load
- Handles Nanite geometry efficiently, but overlaps still impact performance
Distance Field Shadows
- Used by Stationary and Movable lights for soft dynamic shadows
- Without precompute, the baked Stationary overlap limits don't apply
- Performance cost scales with overlapping distance field shadows
Ray Tracing Shadows
- Technically supports many overlapping lights
- But overlapping many ray-traced shadow-casting lights leads to exponential GPU cost
- No fixed engine limit — practical performance is the constraint
MegaLights
- GPU-driven ray tracing lights for high-end platforms
- Supports shadows per light with relatively stable cost
- No strict overlap limit, but total MegaLights with shadows affects GPU workload
- Requires Hardware Ray Tracing support (works fine with Force No Precompute)
Without precompute, your limitation is GPU cost, not engine-enforced light limits. Use Light Complexity view mode to identify overlap hotspots, and use Stat GPU to measure the actual cost. If you see red areas in Light Complexity and high GPU times, consider:
- Reducing shadow quality on less important lights
- Disabling shadows on fill lights
- Using light culling (Attenuation Radius)
- Consolidating multiple small lights into fewer, larger ones
Key Points:
- Use
Stat FPSandStat Unitto measure real performance- Lighting Only (Alt+5) shows pure lighting without materials
- Light Complexity view mode reveals overlap hotspots (green = good, red = expensive)
- Frame time (ms) is more useful than FPS — 16.6ms = 60fps budget
- Test in Play mode, not editor viewport, for accurate results
- With Force No Precompute, there are no engine light limits — GPU cost is your constraint
- Overlapping dynamic shadows scale GPU cost regardless of shadow method
Direct lighting creates highlights and shadows — but real scenes also have fill from the sky and environment. Without it, your shadows are pitch black. In Part 6: Ambient Lighting, we'll add the soft, omnidirectional illumination that brings scenes to life.