What you'll learn:
- Console commands to measure frame time and GPU cost
- How to identify your performance bottleneck
- Editor FPS caps and why your framerate might look wrong
Section 10: Scalability (Lighting Quality) (10 min)
Scalability is Unreal's "quality preset" system. It changes many settings at once, which makes it the fastest way to:
- A/B test lighting quality vs performance
- Match your target hardware
- Understand what's actually expensive (usually Shadows / GI / Reflections)
In the editor:
Settings → Engine Scalability Settings
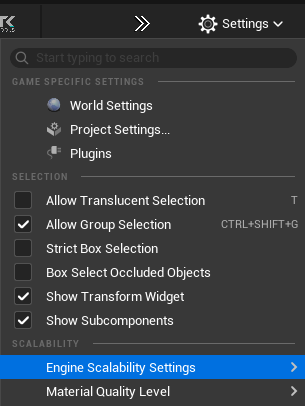 Settings menu - Engine Scalability Settings
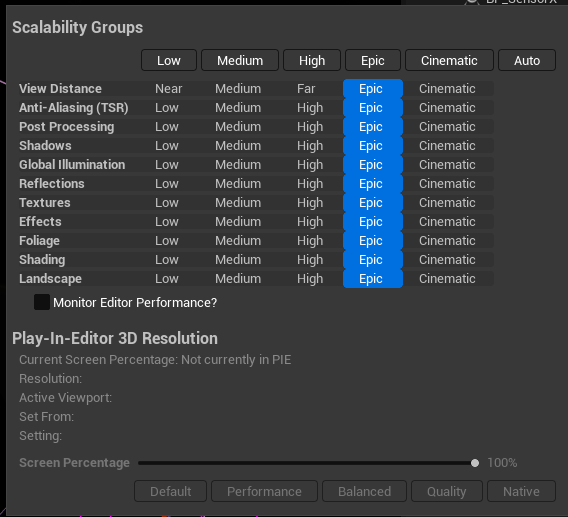 Scalability Groups UI
These modes apply to multiple groups at once (Shadows, GI, Reflections, etc.). In practice:
| Mode | What It Usually Does (for lighting) |
|---|---|
| Low | Lower shadow resolution, fewer samples, reduced/refallback GI & reflections |
| Medium | Better than Low, but still compromises shadow stability and GI/reflection quality |
| High | Good "shipping baseline" for many projects |
| Epic | Great look-dev default; higher-quality shadows and lighting stability |
| Cinematic | Maximum quality; intended for cinematics/offline capture, often expensive |
| Auto | Engine chooses based on performance and heuristics (can change while working) |
| Group | Why It Matters |
|---|---|
| Shadows | Biggest visual impact; also often the biggest GPU cost |
| Global Illumination | Controls GI quality/cost and stability |
| Reflections | Controls reflection quality/cost (especially on glossy/metal surfaces) |
| Post Processing | Exposure/AA/DOF/bloom can affect the perceived "quality" of lighting |
| Anti-Aliasing (TSR) | Impacts stability/shimmering (which can look like shadow noise) |
- Do look-dev at Epic (or Cinematic for final captures).
- When optimizing, change one group at a time (Shadows first, then GI, then Reflections).
- Always validate in the scenario that matters (PIE, target camera, worst-case view).
Scalability is the broad hammer. For precise control, use CVars.
Scalability groups (quick):
sg.ShadowQuality 0-4
sg.GlobalIlluminationQuality 0-4
sg.ReflectionQuality 0-4
VSM deep control: See Part 2: VSM Console Variables for the full list of r.Shadow.Virtual.* CVars.
Ray Tracing Culling CVars:
At far distances, RT culls geometry to save performance. Key CVars:
| Console Variable | Default | What It Does |
|---|---|---|
r.RayTracing.Culling | 3 | Master culling mode (0 = disabled) |
r.RayTracing.Culling.Radius | 10000 | Max distance for RT geometry |
r.RayTracing.Culling.Angle | 1 | Solid-angle culling (base 5°, this is multiplier) |
Tip: If RT shadows disappear on distant objects, test with
r.RayTracing.Culling 0, then tune radius/angle.
Lumen Noise CVars:
| Console Variable | Default | What It Does |
|---|---|---|
r.Lumen.ScreenProbeGather.SpatialFilterNumPasses | 3 | Spatial filter passes (increase for smoother GI) |
r.Lumen.ScreenProbeGather.SpatialFilterHalfKernelSize | 1 | Kernel size for denoising |
Section 11: Monitoring & Debugging Performance (18 min)
When choosing between shadow systems (or adjusting any quality settings), you need objective data. "It looks fine" isn't enough — you need to know your frame budget.
In-Editor (viewport):
- Performance may differ from Play mode — editor has overhead
- Good for quick visual checks, not for final benchmarking
In Play Mode (PIE) — more accurate:
- Closer to actual game performance
- Use this for real measurements
Press ` (backtick) to open console, then use these commands:
| Command | What It Shows |
|---|---|
Stat FPS | Framerate and frame time (ms) |
Stat Unit | Game thread, render thread, GPU time breakdown |
Stat GPU | Detailed GPU pass timings |
ProfileGPU | One-frame GPU capture with hierarchical breakdown |
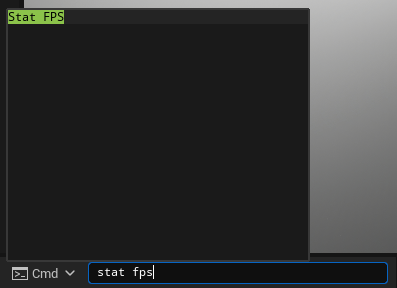 Stat FPS Command
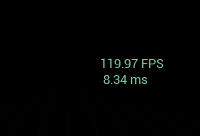 Stat FPS Output
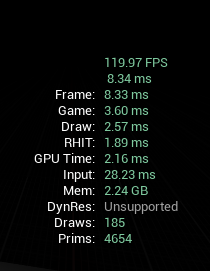 Stat Unit Detailed Output
- Hit Play (Alt+P)
- Open console (`)
- Type
Stat FPS— shows current framerate - Type
Stat Unit— shows where time is spent (Game/Draw/GPU) - Toggle features on/off and compare frame times
Stat Unit breaks down frame time into:
| Thread | What It Measures |
|---|---|
| Game | Game logic, Blueprints, AI, physics |
| Draw | CPU time preparing render commands |
| GPU | Actual GPU rendering time |
Your bottleneck is the largest number. If GPU time is highest, lighting/shadows are likely the culprit.
Unreal caps framerate by default, which can hide your actual performance. To get accurate measurements:
Check if FPS is capped (console):
t.MaxFPS
Returns current cap (0 = uncapped)
Uncap FPS temporarily (console):
t.MaxFPS 0
Now you'll see true performance. Useful for benchmarking.
Set a specific cap (console):
t.MaxFPS 60
t.MaxFPS 120
Project Settings (permanent):
Project Settings > Engine > General Settings > Framerate:
    ☐ Use Fixed Frame Rate — unchecked = uncapped
    ☑ Use Fixed Frame Rate — checked = uses value below
    Fixed Frame Rate: 60.0 (or your target)
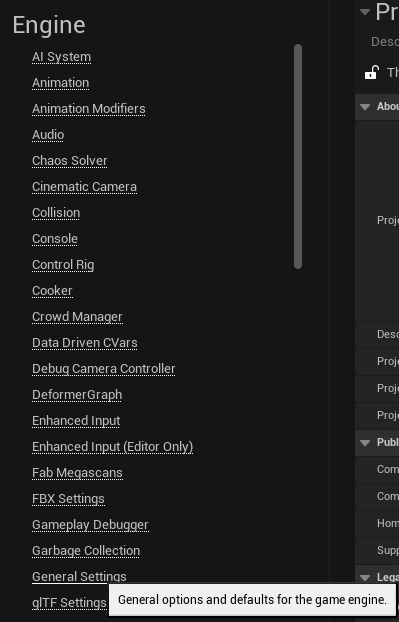 Engine General Settings Navigation
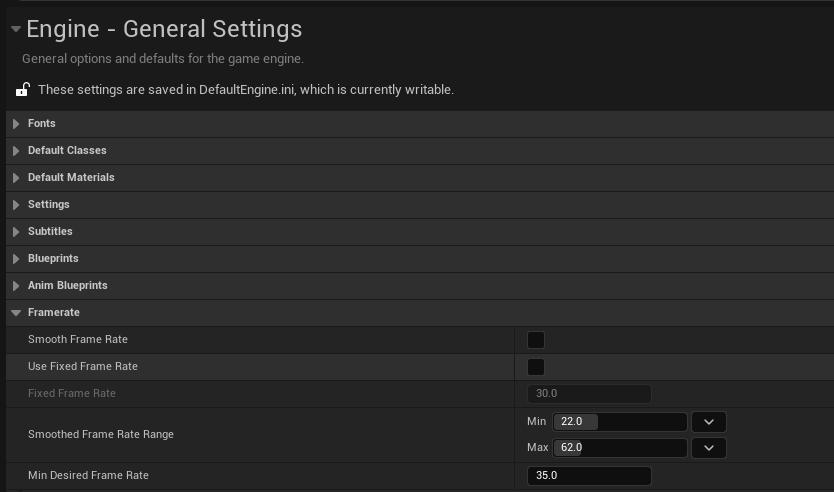 Engine General Settings - Framerate
The editor viewport has its own cap separate from Play mode. To display FPS in the editor:
Editor Preferences > General > Performance:
    ☑ Show Frame Rate and Memory
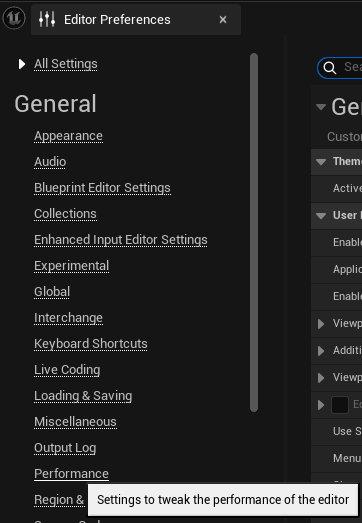 Editor Preferences
 Editor Performance Setting
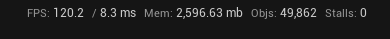 Editor FPS Display
Frame time (in ms) is more useful than FPS for optimization because it's linear.
| Target FPS | Frame Budget |
|---|---|
| 30 fps | 33.3 ms |
| 60 fps | 16.6 ms |
| 120 fps | 8.3 ms |
If GPU time exceeds your budget, reduce quality settings or switch shadow methods.
- A/B test: Change one setting, compare frame times
- Worst case: Find your most expensive view/area
- Consistency: Multiple samples, not just one frame
- Real content: Test with final art, not placeholder boxes
Key Points:
- Use
Stat FPSandStat Unitto measure real performance- Frame time (ms) is more useful than FPS — 16.6ms = 60fps budget
- Test in Play mode, not editor viewport, for accurate results
- Editor has its own FPS cap (check
t.MaxFPS)